
티스토리 뷰
반응형
서버 머신의 네트워크 트래픽을 모니터링 할 일이 생겨서 여러가지 툴을 알아보다 'iftop' 명령과 'nethogs' 명령을 알게 되었다. iftop 명령이 서버의 NIC 레벨에서 트래픽을 모니터링하는 도구였다면 'nethogs' 명령은 서버의 운영체제에서 프로세스 레벨로 트래픽을 모니터링 할 수 있는 도구다.
nethogs 설치
nethogs 명령은 패키지 관리 유틸리티인 yum 혹은 apt-get으로 쉽게 설치할 수 있다.
# Ubuntu
$ sudo apt-get install nethogs
# Centos
$ sudo yum install nethogs
nethogs 사용법
'nethogs' 명령의 사용법은 굉장히 간단하다.
$ sudo nethogs {인터페이스 이름}nethogs 명령의 인자로 인터페이스 이름을 명시하면, 모니터링 정보를 확인 할 수 있다.
$ sudo nethogs etho0nethogs에 인자를 안주면 첫 번째 인터페이스가 사용된다.
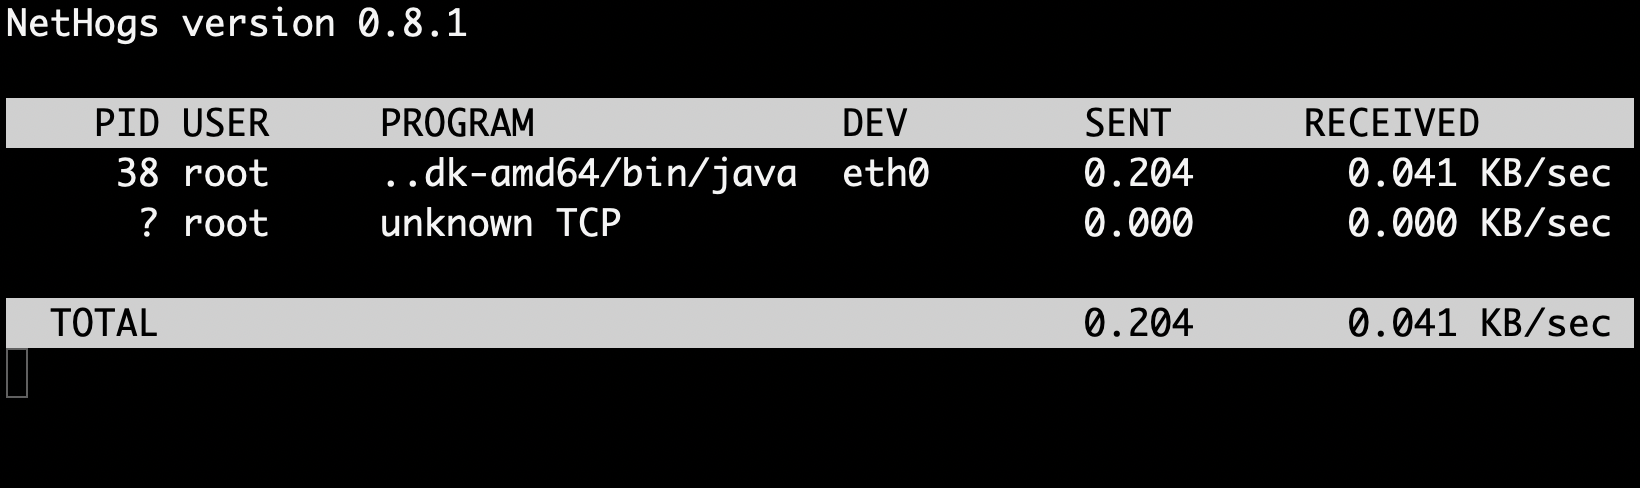
nethogs 명령을 실행하면 위 사진에서 볼 수 있는 것처럼 PID 별로 전송하고 받는 트래픽 정보를 확인할 수 있다.
nethogs 옵션
nethogs -h 명령을 실행하면 nethogs에서 사용할 수 있는 옵션을 확인할 수 있다.
$ sudo nethogs -h
usage: nethogs [-V] [-h] [-b] [-d seconds] [-v mode] [-c count] [-t] [-p] [-s] [device [device [device ...]]]
                -V : prints version.
                -h : prints this help.
                -b : bughunt mode - implies tracemode.
                -d : delay for update refresh rate in seconds. default is 1.
                -v : view mode (0 = KB/s, 1 = total KB, 2 = total B, 3 = total MB). default is 0.
                -c : number of updates. default is 0 (unlimited).
                -t : tracemode.
                -p : sniff in promiscious mode (not recommended).
                -s : sort output by sent column.
   -a : monitor all devices, even loopback/stopped ones.
                device : device(s) to monitor. default is all interfaces up and running excluding loopback

When nethogs is running, press:
 q: quit
 s: sort by SENT traffic
 r: sort by RECEIVE traffic
 m: switch between total (KB, B, MB) and KB/s mode
자세한 설명은 매뉴얼 페이지를 확인하면 된다. (링크 : nethogs(8) - Linux man page)
반응형
댓글
반응형
공지사항
최근에 올라온 글
최근에 달린 댓글
- Total
- Today
- Yesterday
링크
TAG
- 텃밭
- 화분
- Python
- docker
- 파이참
- 베란타 텃밭
- nf_conntrack
- InterlliJ
- 상추 재배기
- 자바
- 고추
- 리눅스
- 깃허브
- pycharm
- monitoring
- 베란다 텃밭
- 청양고추
- 도커
- 화분 버리기
- linux
- GitHub
- Jekyll
- 파이썬
- hadoop
- 지킬
- java
- MacOS
- okhttp
- 하둡
- 상추
| 일 | 월 | 화 | 수 | 목 | 금 | 토 |
|---|---|---|---|---|---|---|
| 1 | 2 | 3 | 4 | 5 | 6 | |
| 7 | 8 | 9 | 10 | 11 | 12 | 13 |
| 14 | 15 | 16 | 17 | 18 | 19 | 20 |
| 21 | 22 | 23 | 24 | 25 | 26 | 27 |
| 28 | 29 | 30 |
글 보관함